You might wonder how many times I can write a blog highlighting how different California is from the rest of the country when it comes to density. After all, I started on this screed back in 2001, when I co-authored Who Sprawls Most? And just a month ago I wrote a blog noting that, according to the Census Bureau, California metros are densifying while their counterparts elsewhere are not.
But evidence just keeps on coming. Now the Environmental Protection Agency has provided a compelling long-view look at density patterns in major metropolitan areas in the United States � which reveals this pattern has held over the past 60 years.
The other day EPA issued the second edition of its turgidly titled Our Built and Natural Environments: A Technical Review of the Interactions Between Land Use, Transportation, and Environmental Quality, an overview of a wide variety of environmental impacts of human settlement and the built environment. And buried in that report � Exhibit 2-2 on page 8 � is a pretty interesting table examining metropolitan population growth versus urban expansion in the last 60 years, since the Census Bureau first started keeping track of such things in 1950.
What the table shows is that for the 39 largest metro areas that were delineated in 1950, population grew 150% over the 60 years while the urbanized area expanded 400% -- meaning urbanized area grew 2.5 times faster than population. (The Census defines an urbanized area as any Census tract that has a population of 1,000 persons per square mile or more, so it tends to underestimate low-density sprawl � but it's still a useful measure.)
Some of the statistics are truly frightening. For example, Metro Pittsburgh's population grew by 19% while its land area grew by 257%. Metro Detroit's population grew by 36% while its land area grew by 216%. Metro Boston's population grew by a healthy 87% -- but its land area grew by 665%. These are the parts of the country that are truly sprawling.
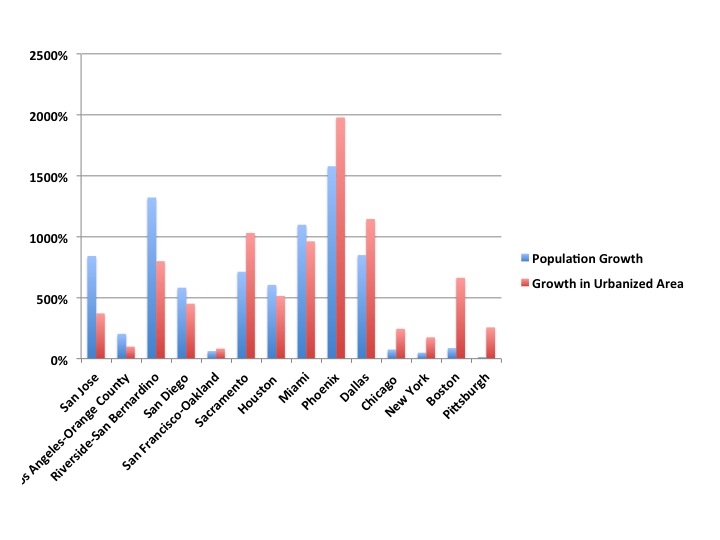
And California? Nope, not sprawling. In fact, San Diego, LA-Orange County, the Inland Empire and San Jose all saw its population grow faster than urbanized area � something that only seven of the 39 metro areas achieved.
Overall, California's metros added 240% to its population and only 195% to its land area. For the non-California metros among the 39 metros studied, population grew by 150% and land area grew by 455%.
This chart showing these figures for selected metros in California and elsewhere gives the general picture. (I derived this chart from the table in the EPA report.) It's interesting to note that Miami and Houston followed the California pattern, as did � to a lesser extent � Dallas and Houston.